
Making monitoring and alerting easy
30 day trial
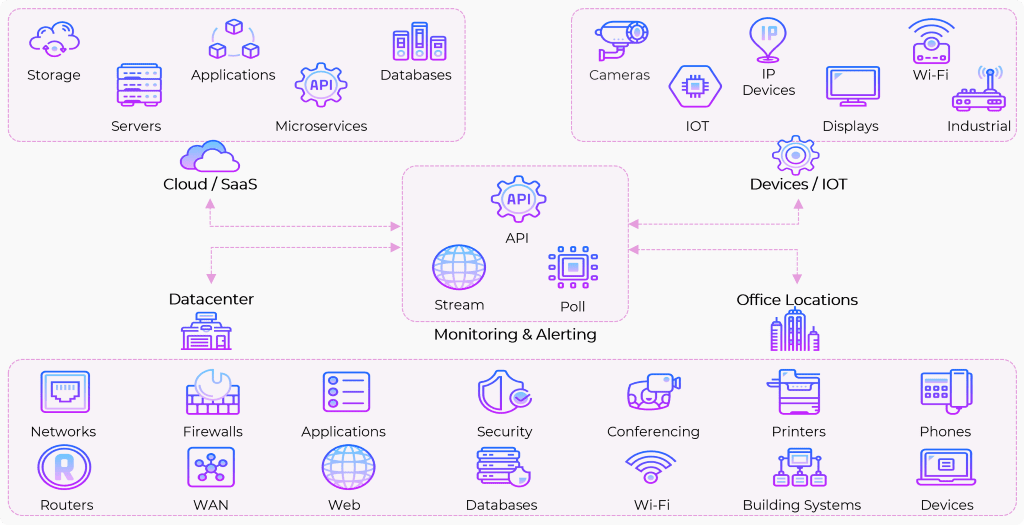
What can be monitored?
In simple terms, if you can gather it, we can monitor it. We support a variety of open standards and methods for collecting agentless, agent-based, and streaming data. Monitor and alert across Networking, IOT, Wan/SD-WAN, Public Clouds, Private Clouds, Infrastructure, Container Platforms and Web/SaaS platforms. The monitoring platform can also be used for KPI monitoring, capacity monitoring and inventory data gathering. Below are some of the products and platforms we support as well as the features and benefits of using this solution.
Monitoring platform features
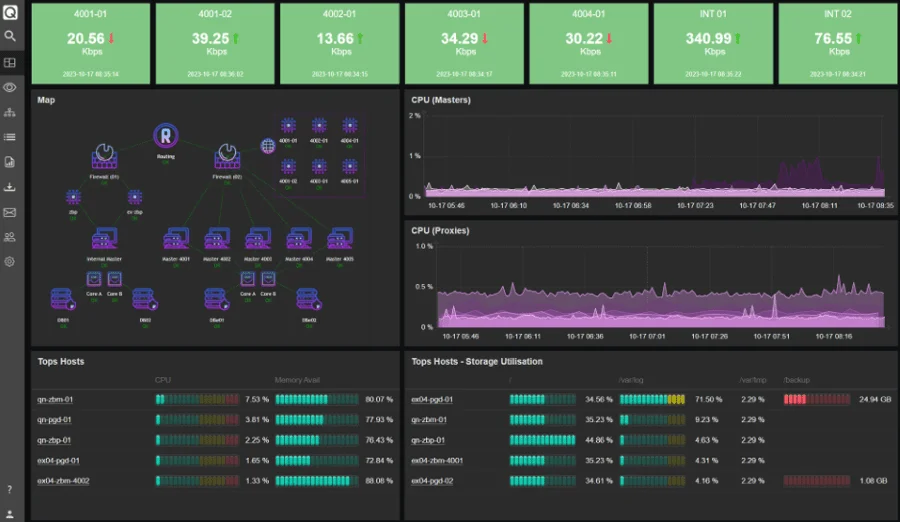
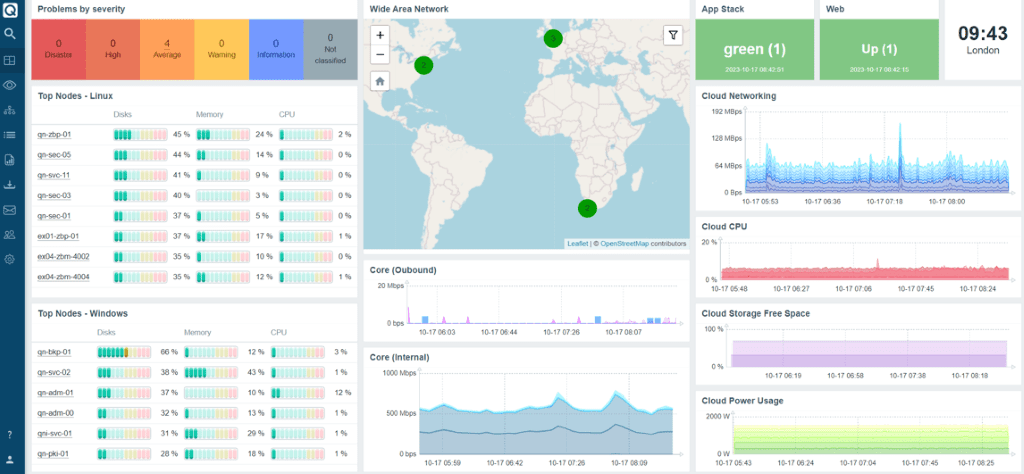
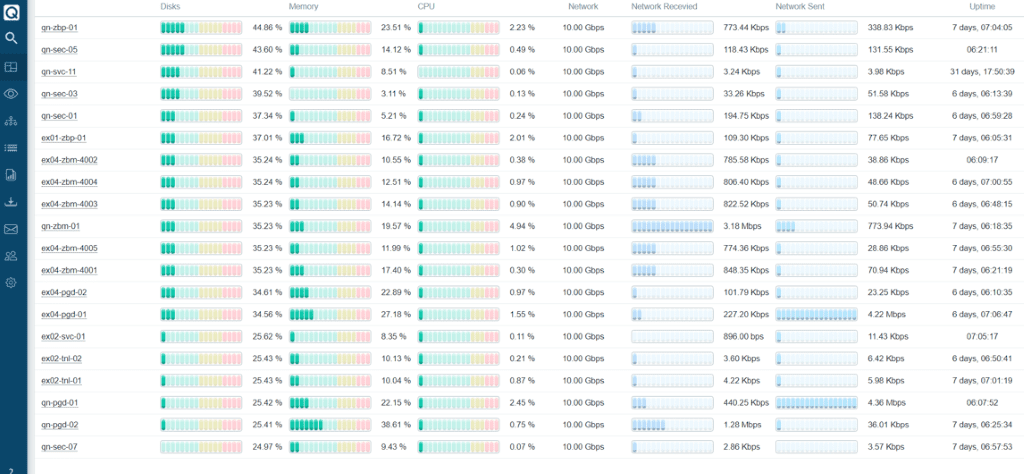
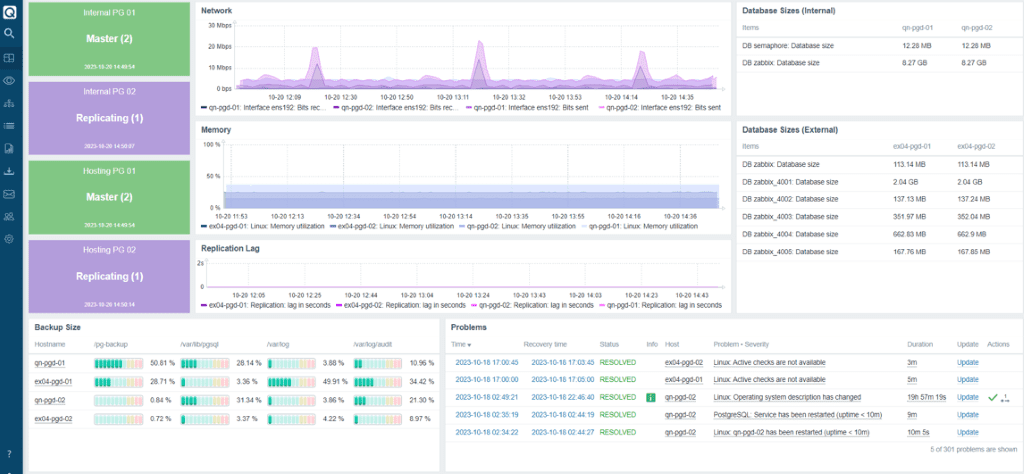
A single pane of glass
- Create summary and near real-time information graphs on devices, metrics, availability, issues and problems as a single unified management interface
- Create customised, automated and scheduled reports – sent via email
- Access the management via a web/ssl from anywhere in the world
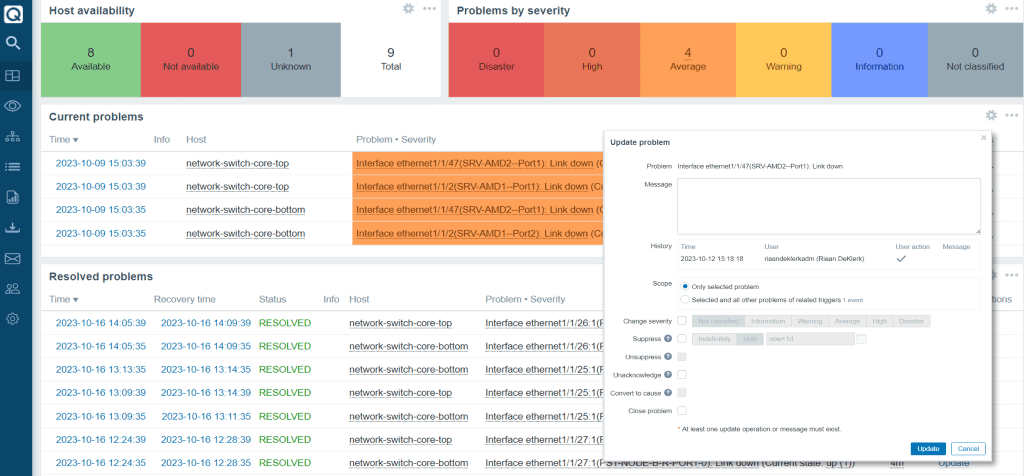
Detect problems early
- Flexible problem definitions and multiple problem severity levels
Correlate root cause analysis and anomaly detection
Do data trend analysis and monitor business services and SLA’s
Proactively alert across several integrated platforms like email, slack, servicenow and telegram
Monitor at scale
- Configure in minutes, start small and scale out without the need to rebuild
- Monitor from behind the firewall or locally - appliances (proxies) can be deployed globally for large scale distributed data
- Use out-of-the-box templates for most of the popular platforms or create your own custom metrics
Collect data anywhere
- Agentless monitoring via ping, port checks and SNMP (all versions) – polling and SNMP Traps
- Agentless monitoring via HTTP/S, IPMI, SSH, WMI, ODBC, MQTT, Modbus
- Agentless monitoring of Java applications, Web APIs and HTTP endpoints
- Agent based monitoring (optional) for Windows, Linux, Unix, AIX, FreeBSD
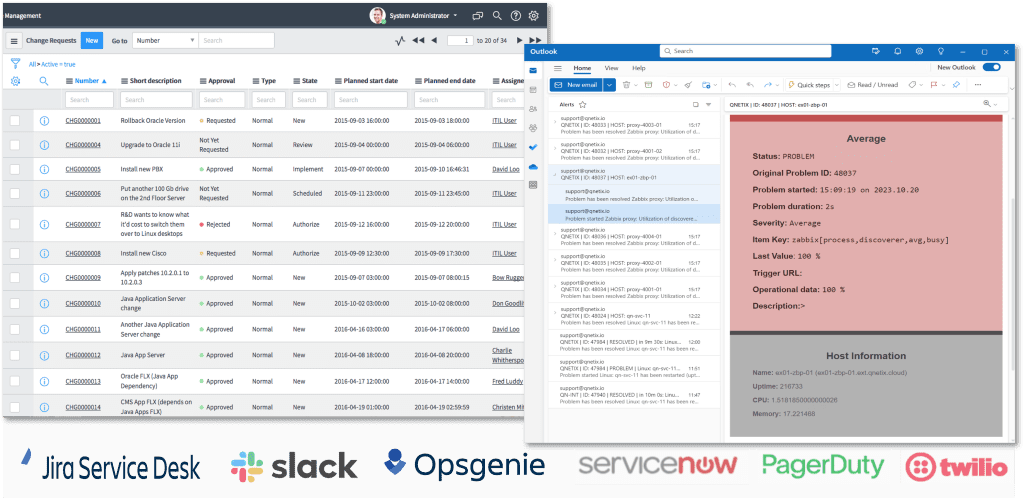
Alerting and notifications
Pre-configured integration with popular 3rd party applications with flexibility to create your own
- Send alerts via E-mail, SMS or Webhooks – or directly to your service desk / NOC
- Remediate issues automatically by executing commands/scripts when errors occur
- Escalate problems according to flexible user-defined service levels
Monitoring, the easy way
- We take care of all the infrastructure, configurations and maintenance – including any upgrades
- We support you in full to get up and running, including deployment of any local software, through to support in configuring the first devices
We remediate issues when they occur. All systems are monitored continually and are configure with strong encryption between all components
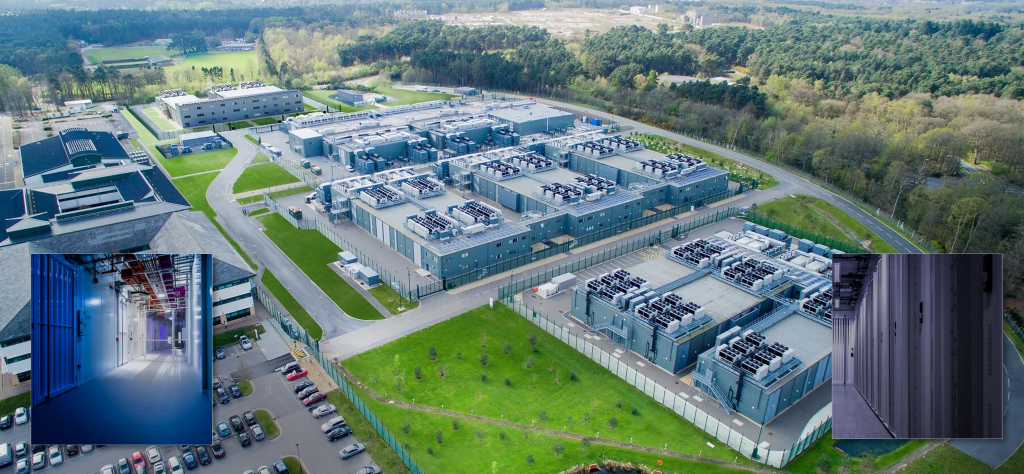
Monitoring, the secure way
Tier III datacenter facilities and comply with the strict security and operational standards
Enterprise tier 1, redundant systems
Multiple authentication methods available including Open LDAP and Active Directory
Customisable options to store all sensitive credentials in an external vault. No data is shared or transferred to external 3rd parties
Building your own versus using our service

Do it yourself can be expensive
Hosting, servers, setup, troubleshooting, management, and support make DIY monitoring solutions difficult. Our team has done the heavy lifting, and we handle all optimisations, scaling, and security for you – either as a part of our shared platform or as dedicated instances.

Monitoring gets complicated
Your applications and systems have a lot of metrics to monitor which can be overwhelming. Overlay the additional burdens of keeping the monitoring platform stable, secure, and up to date often means that companies end up with near dedicated staff for monitoring. We have a dedicated engineering team and the right scalable and secure platforms that give you the peace of mind that your monitoring will just work.

Opensource with expert support
Using proprietary management and monitoring systems often lead to vendor lock-in or multiple management and monitoring systems that required constant management or integration. Our solution is fully tested and is based on a simple pricing model with no hidden fees. With our solution, startups to high-performing operations and devops teams can easily analyse shareable information and metrics, create custom time series metrics, and receive responsive alerting with reliable support at fraction of the cost of a full-time employee.

Tailored support and precision
Every business has its unique monitoring challenges. Our team works closely with you, offering tailored support to ensure your monitoring environment is fine-tuned to your specific needs. From initial setup to advanced configurations, we're here to get things right.

Optional fully managed monitoring
We additionally offers bespoke, fully managed monitoring services. With our deep expertise and commitment to excellence – we are revolutionising and simplifying monitoring. Our tools, processes, platforms capabilities - combined with our passion for customer success, ensures that you get the most out of your monitoring solution.
